What Posted Speed Limits Actually Represent
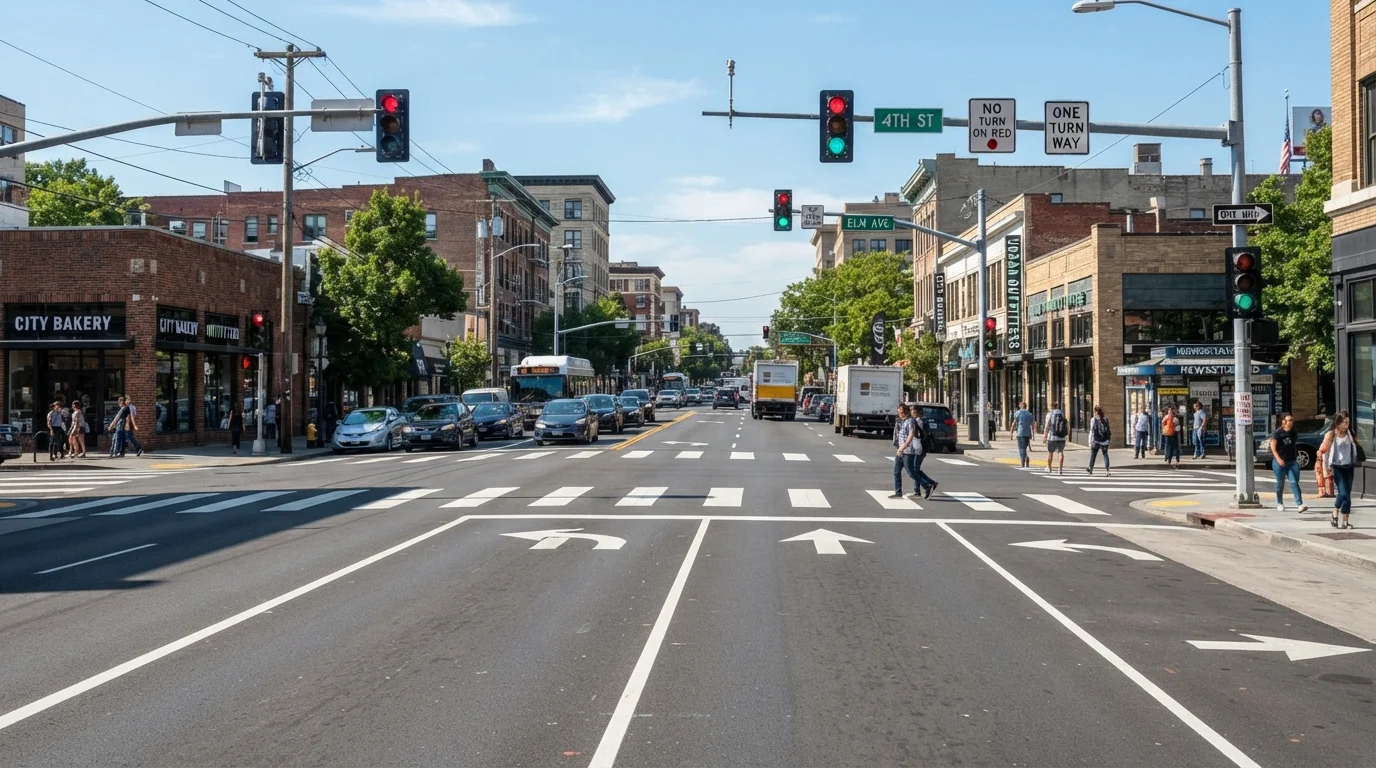
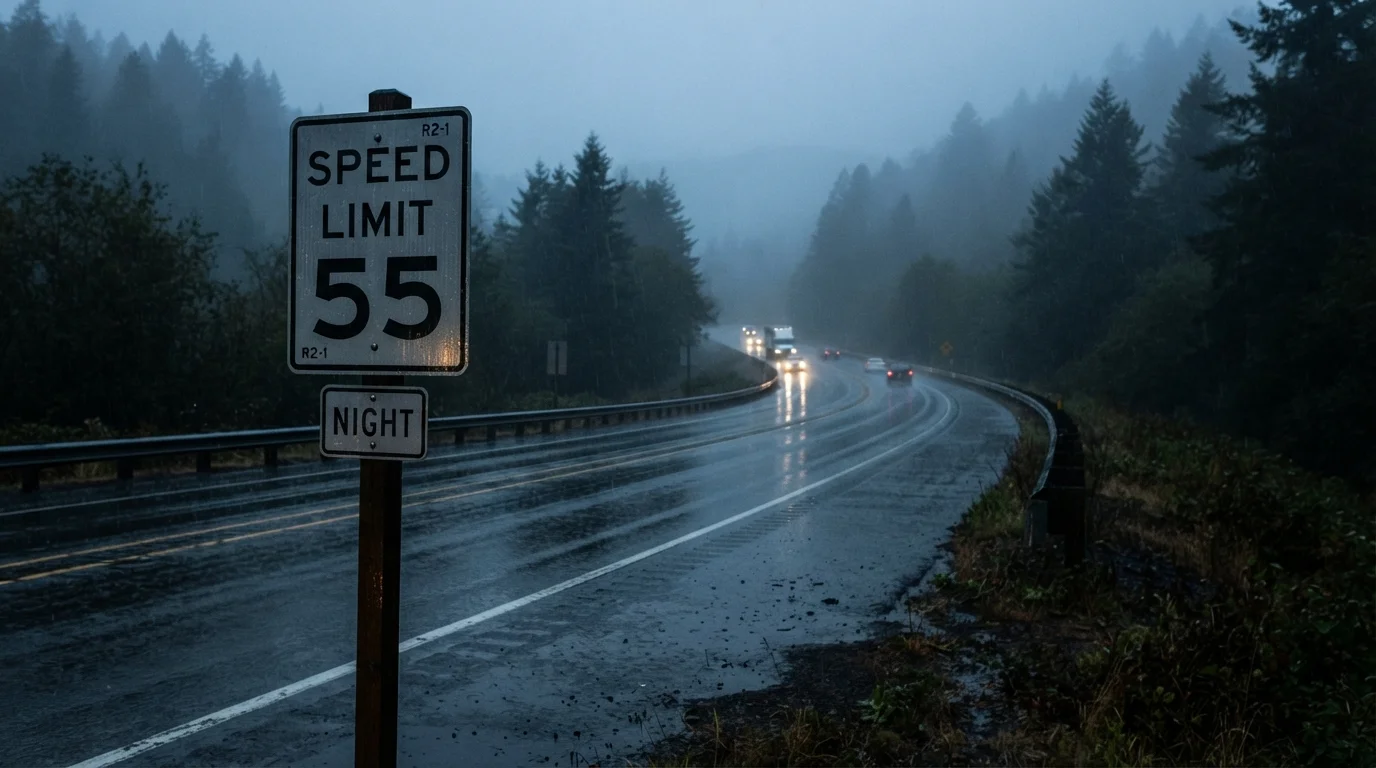
Speed limit signs are set through an engineering process - typically based on road geometry, lane width, sight distance, and the 85th percentile speed (the pace at or below which 85% of free-flowing traffic travels under ideal conditions). They represent a legal ceiling, not a universal recommendation. Crucially, they assume dry pavement, good visibility, and normal traffic volume.
Understanding this distinction matters. As the Cars & Driving Editorial Team notes, many drivers treat the speed limit as the target speed regardless of surroundings - which is exactly the mindset that leads to preventable crashes. For a broader look at the rules that govern your driving, see U.S. traffic law fundamentals.
| Criterion | Posted Speed Limit | Safe Traveling Speed |
|---|---|---|
| Set by | Traffic engineers and lawmakers | Real-time road conditions |
| Assumes | Ideal, dry, daylight conditions | Actual visibility, traction, traffic |
| Legal status | Maximum enforceable limit | Required by basic speed laws |
| Changes with weather | No - sign stays the same | Yes - must decrease in poor conditions |
| Applies in construction zones | Reduced limit posted separately | Further reduction may be needed |
| Driver responsibility | Do not exceed this number | Actively judge appropriate pace |
The Law Behind 'Safe Speed' - It's Not Just Common Sense
Most U.S. states codify a basic speed law - a statute requiring drivers to operate at a speed that is reasonable and prudent for existing conditions, regardless of the posted limit. In practical terms, this means you can receive a traffic citation for traveling at the speed limit if weather, congestion, or visibility make that speed unsafe. California, Texas, New York, and dozens of other states include this language in their vehicle codes.
Conversely, some roads carry advisory speed signs on curves - lower numbers posted on yellow signs - which indicate the safe cornering speed for that geometry. These are not enforceable limits, but ignoring them significantly raises rollover and loss-of-control risk.
3x
Longer stopping distance on ice vs. dry pavement
The Federal Highway Administration notes that stopping distances on ice can be up to three times greater than on dry roads at the same speed.
88 ft/sec
Distance traveled per second at 60 mph
At 60 mph, a vehicle covers approximately 88 feet every second - often exceeding standard low-beam headlight range on rural roads.
~40%
Fatal crashes involving excessive speed
NHTSA data consistently shows that speeding - including driving too fast for conditions - is a factor in roughly 40% of traffic fatalities in the U.S.
Conditions That Should Lower Your Speed Below the Limit
Several real-world factors reduce the speed at which you can safely stop, steer, and react - all independent of what the sign says.
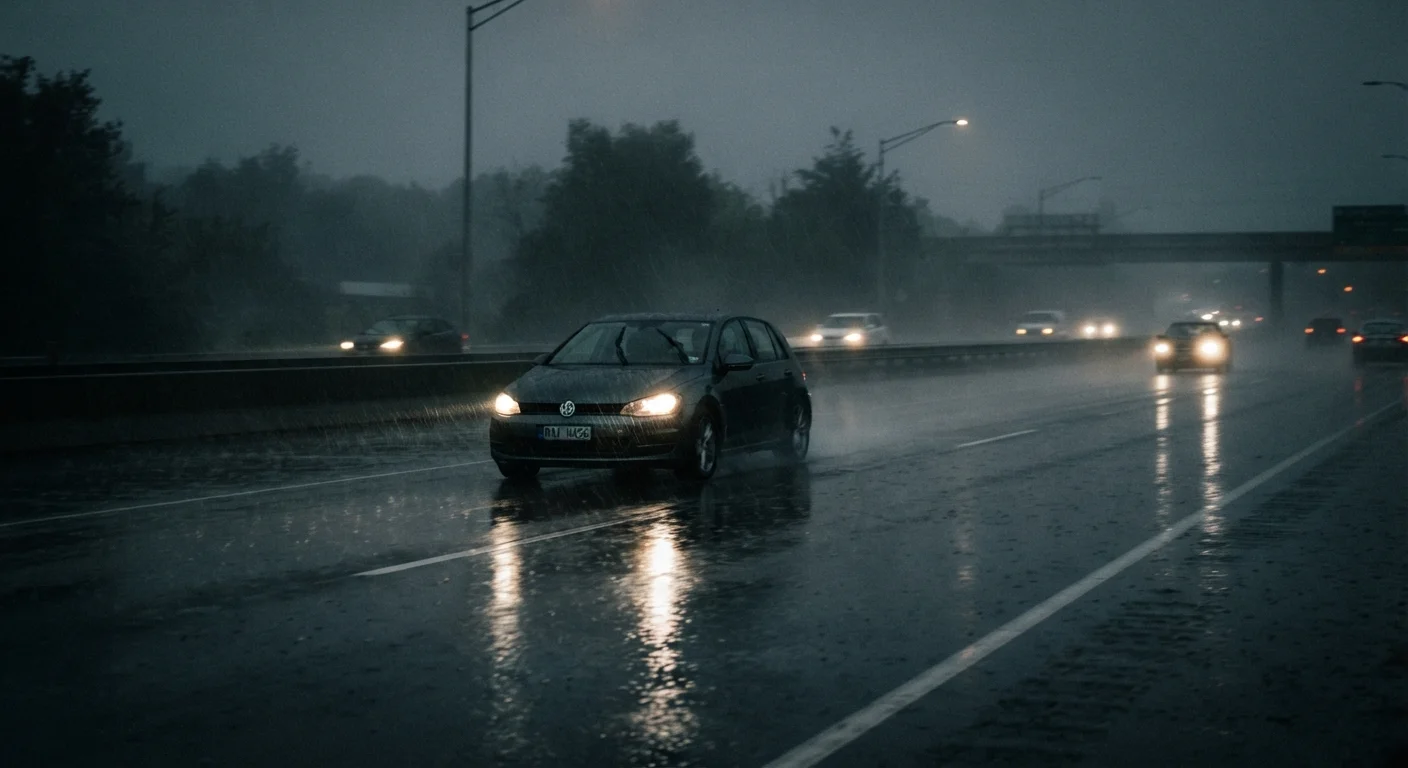
- Precipitation: Rain reduces tire traction; ice can reduce it by as much as 90%. See our detailed breakdown of adjustments in driving in rain, snow, and fog.
- Reduced visibility: Fog, glare, and darkness shrink the distance in which you can identify hazards. At 60 mph you travel 88 feet per second - well beyond most headlight ranges on rural roads.
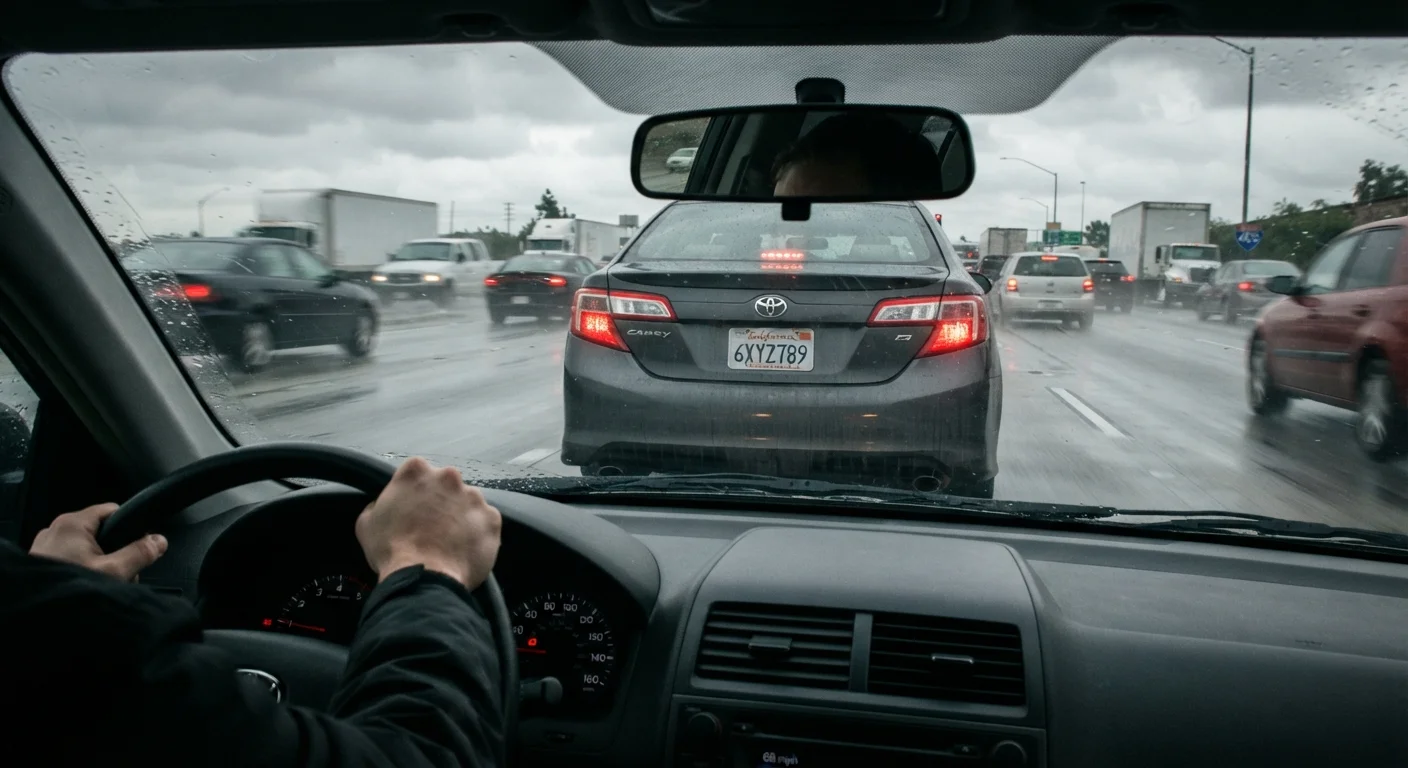
- Heavy traffic: Shorter gaps between vehicles demand faster reaction times. Slowing slightly also reduces the severity of any rear-end scenario. Following distance and stopping distance are directly tied to your speed.
- Road surface defects: Potholes, gravel, uneven pavement, and construction zones all reduce vehicle stability, especially in curves.
- Other road users: Cyclists, motorcyclists, and large trucks behave differently at speed. Sharing the road safely means accounting for their stopping distances and blind spots.
Highway and city environments also call for different instincts - speed management looks different on a 70 mph interstate versus a 35 mph boulevard. For a side-by-side breakdown, see highway vs. city street driving.
Making the Judgment Call: A Practical Framework
Rather than defaulting to the posted number, skilled drivers run a quick mental check before and during any drive:
- Traction assessment: Is the road dry, wet, or frozen? Reduce speed proportionally.
- Visibility range: Can you stop within the distance you can clearly see? If not, slow down.
- Traffic density: Is the gap between you and the vehicle ahead shrinking? Ease off the accelerator before braking becomes necessary.
- Fatigue and distraction: Both increase reaction time. A tired driver at the speed limit is functionally similar to an impaired driver - slow down and rest when needed.
The posted limit remains the legal upper boundary. A safe traveling speed is whatever falls at or below that number given the conditions you are actually driving through. These two figures coincide less often than most drivers assume.
This article provides general driver education and is not a substitute for guidance from a qualified driving instructor or your state's official driver handbook.